
EPL, Favourites, and Gambling
I watch a lot of football, and I think about statistics a fair bit too.
I wondered how well bookies deal with simple season-long strategies. For example, if I bet $5 on the betting favourite for the whole season, would I make any money?
Fortunately, this data is readily available and I did not have to risk anything to answer my curiosity.
All data was downloaded from: football-data.co.uk
To calculate whether betting on favorites will make money takes three steps:
- Figure out who is the favourite (from the odds)
- Figure out who won (from the score)
- Determine if that is the same team
If it is the same team, then I win! If they are not, then i lose :(
I calculate this for every game of the season, calculate how much I would win or lose per match day, then calculate that over the entire season.
suppressPackageStartupMessages({
  library(stringr)
  library(ggplot2)
  library(dplyr)
  library(lubridate)
  library(knitr)
  library(tidyr)
  library(RColorBrewer)
  library(kableExtra)
})

# Set up defaults for R code
knitr::opts_chunk$set(warning = FALSE, message = FALSE, fig.align = 'center')


results = read.csv("2223_EPL.csv")

# Function for calculating favourite
get_result = function(r, bet = 5){
  # using sapply retains names
  odds = sapply(r[c("B365H", "B365A")], as.numeric)
  score = sapply(r[c("FTHG", "FTAG")], as.numeric)

  # If odds are equal, this will favour the home team
  fav = str_extract(names(odds)[which.min(odds)], "[HA]")
  win = r["FTR"]

  if(fav == win & fav == "H"){
    returning_bet = (odds["B365H"] * bet) - bet
  }
  if(fav == win & fav == "A"){
    returning_bet = (odds["B365A"] * bet) - bet
  }
  if(fav != win) {
    returning_bet = -5
  }
  returning_bet
}

# Calculate results for every match
results$alwaysfav = apply(results, 1, get_result)

# Give each matchday a unique identifier
results$day_ofseason = match(results$Date, unique(results$Date))

# Calculate the total for each matchday
cumsum_year = results %>%
  group_by(day_ofseason) %>%
  mutate(daily_total = sum(alwaysfav)) %>%
  ungroup() %>%
  mutate(daily_cumsum = cumsum(daily_total)) %>%
  select(Date, day_ofseason, daily_total, daily_cumsum)

# Plot the total for each matchday over the year
ggplot(cumsum_year, aes(x = day_ofseason, y = daily_cumsum)) +
  geom_line() +
  geom_hline(yintercept = 0, col = "red", lty = "dashed") +
  ggtitle("EPL 22/23 Season", "$5 on every favourite") +
  xlab("Days of the season") +
  ylab("Cumulative Total ($)")
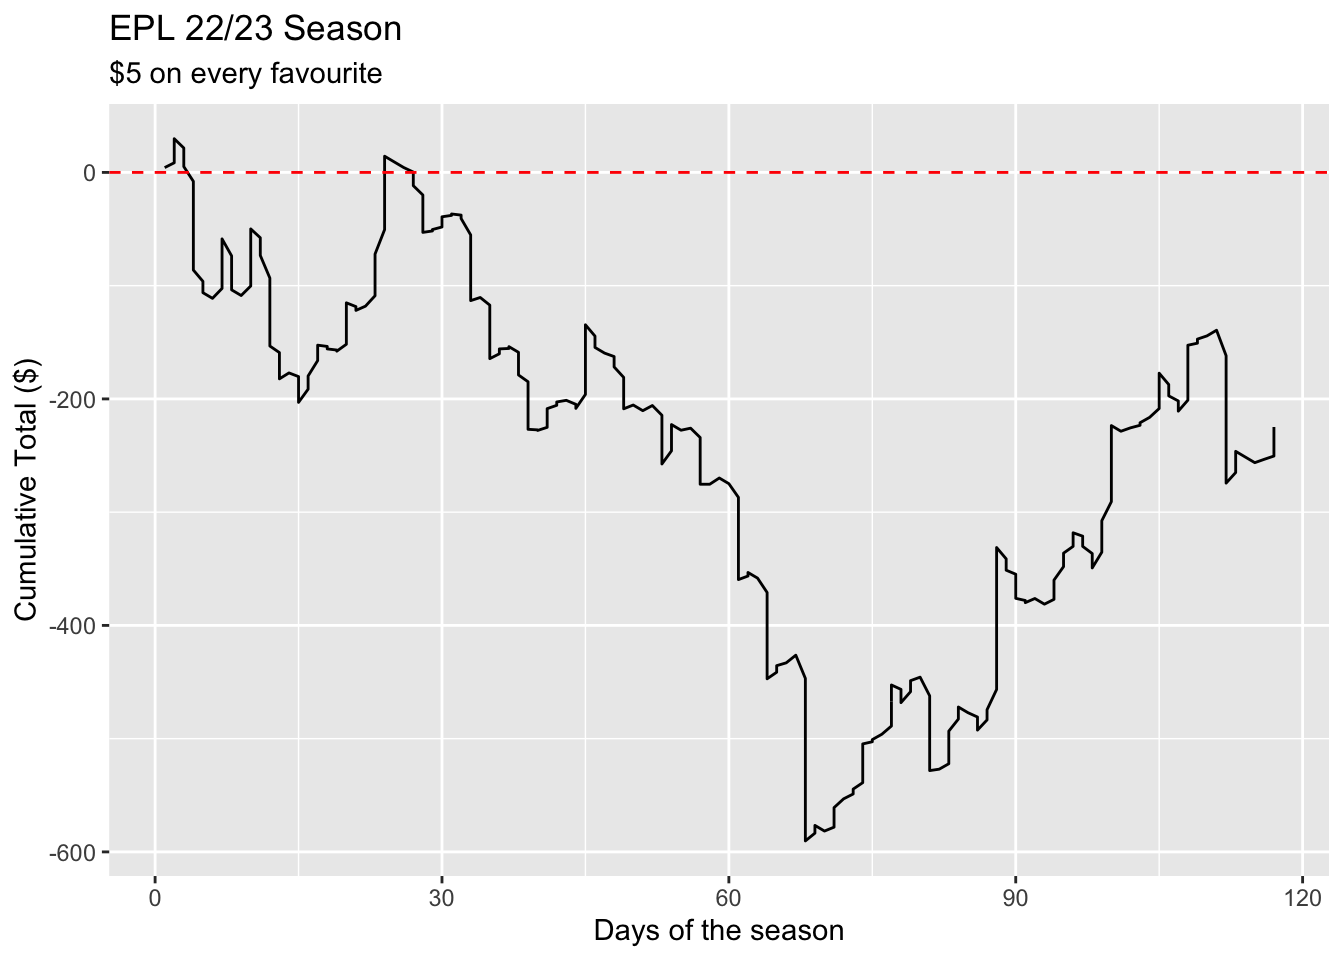
For the most recent season, betting on the favourite is a terrible strategy and would see you lose the season with around -$200 if you are betting $5 per game. That is not a good result.
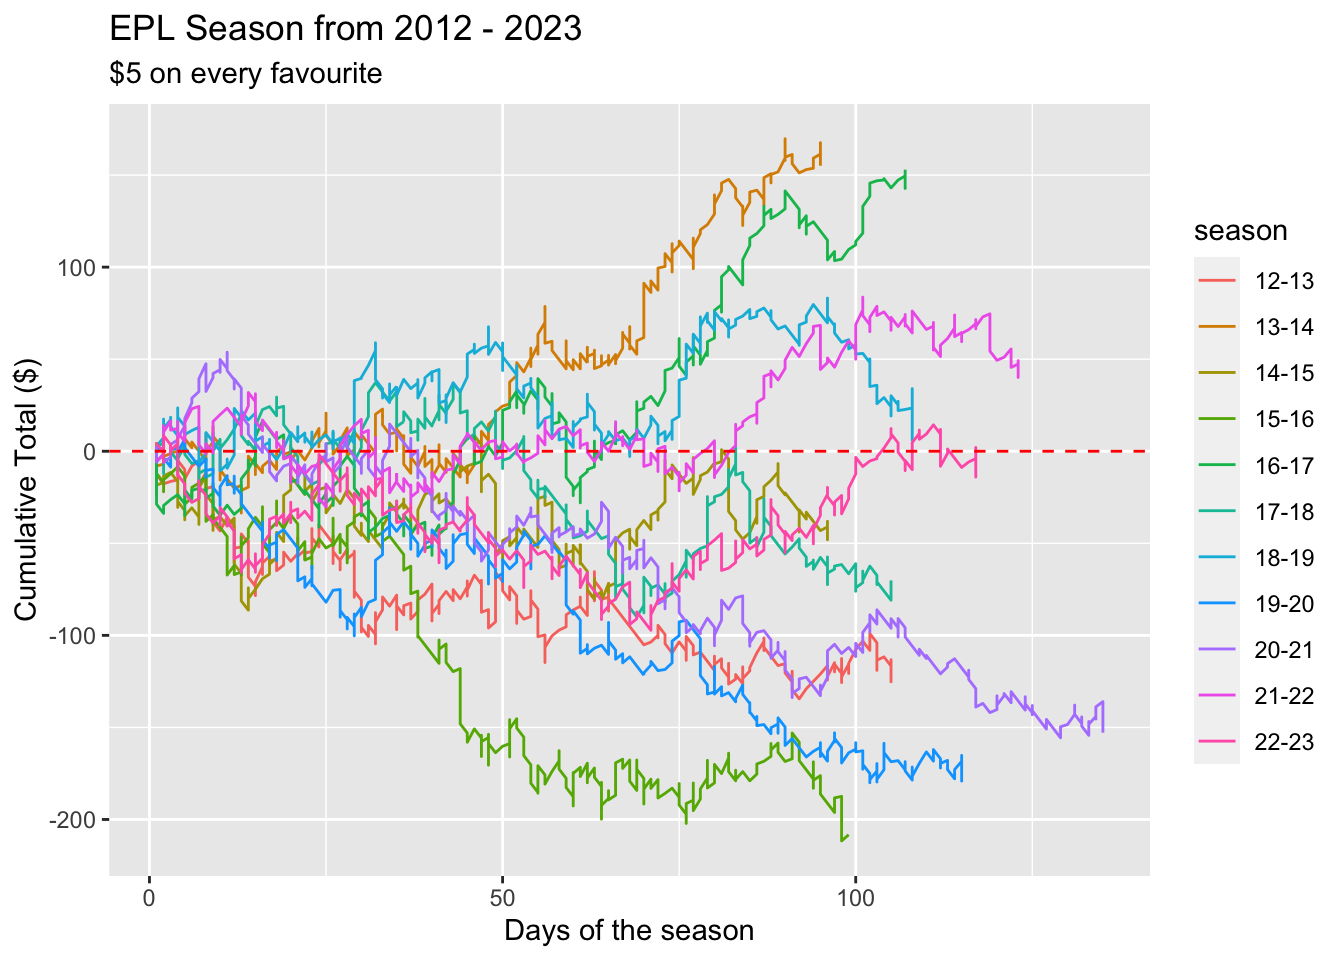
But has this strategy ever worked?
Last 10 seasons
Is this a one season wonder or, is this a regular pattern in the premier league?
csv_files = list.files(path = ".", "*.csv")
all_results = lapply(csv_files, read.csv)
names(all_results) = str_extract(csv_files, "[0-9]+")

all_results = lapply(all_results, function(x){
  x$day_ofseason = match(x$Date, unique(x$Date))
  x
})

all_results = bind_rows(all_results, .id = "season")

# make season labels pretty
all_results$season = gsub("(\\d{2})(\\d{2})$","\\1-\\2", all_results$season)

# remove missing dates
all_results = all_results[all_results$Date != "",]

all_results$alwaysfav = apply(all_results, 1, get_result, bet = 5)

cumsum_year = all_results %>%
  group_by(season, day_ofseason) %>%
  mutate(daily_total = sum(alwaysfav)) %>%
  group_by(season) %>%
  mutate(yearly_cumsum = cumsum(alwaysfav))

ggplot(cumsum_year, aes(x = day_ofseason, y = yearly_cumsum, col = season)) +
  geom_line() +
  ggtitle("EPL Season from 2012 - 2023", "$5 on every favourite") +
  geom_hline(yintercept = 0, col = "red", lty = "dashed") +
  xlab("Days of the season") +
  ylab("Cumulative Total ($)")
# Make a table of results
aggregate(cumsum_year$yearly_cumsum, by=list(cumsum_year$season), FUN=last) %>%
  kable(., col.names = c("Season", "Final Total"), format = "html") %>%
  kable_styling(full_width = F)
| Season | Final Total |
|---|---|
| 12-13 | -125.55 |
| 13-14 | 155.10 |
| 14-15 | -43.05 |
| 15-16 | -208.30 |
| 16-17 | 152.95 |
| 17-18 | -70.15 |
| 18-19 | 5.50 |
| 19-20 | -170.20 |
| 20-21 | -152.85 |
| 21-22 | 47.10 |
| 22-23 | -2.95 |
A simple strategy of always bet the favourite isn’t always a terrible idea. In four of the 11 seasons looked at, this strategy would give you a net gain (36%). Not really good enough odds to rely on though.
If you had used this strategy across these seasons, you’d be $412.2 out of pocket. Which is a lot of time used to lose 400 big ones.
Playing the odds
An interesting fact about dollar betting is that the inverse of the dollar odds on a bet with only two outcomes is approximately the probability that the bookie is giving that outcome.
So, lets consider a match of tennis, either player A wins or player B wins. Unlike football, where there is the possibility of a draw.
If we have no idea who is going to win, we might give both players $2 odds, the inverse of which is 0.5 or a 50-50 chance of either player winning.
Of course, if we ran our bookies this way, our profit would be entirely dependent on the public’s betting patterns, and we would go broke very quickly. So most bookies will offer odds that add up to greater than 100%, to ensure we have some more-or-less guaranteed profit. In two-way bets, like our tennis example, it would be common to see bets of 1.90 for each outcome.
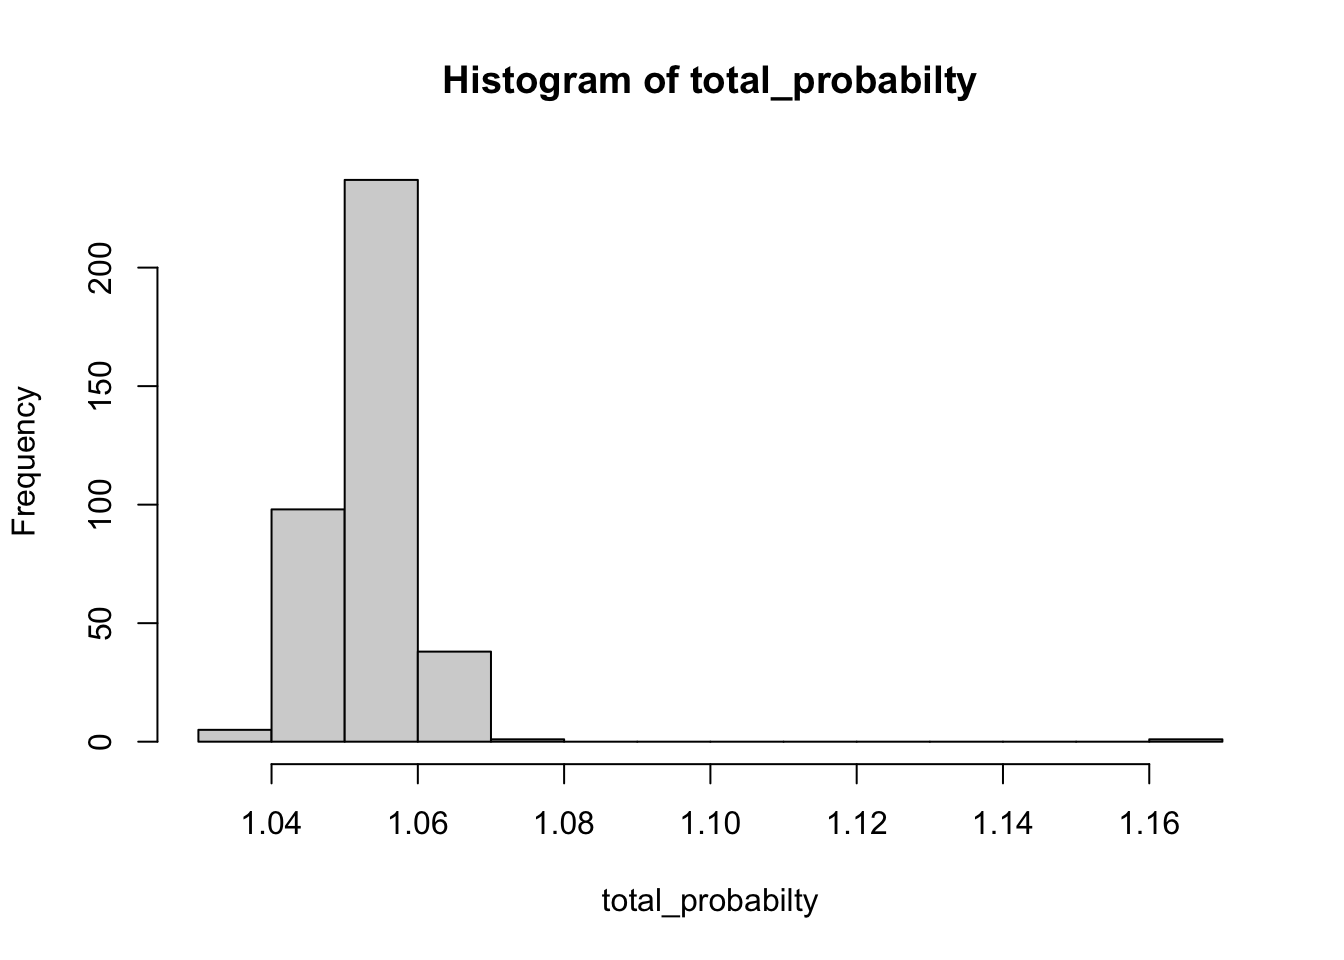
In this example: 1 / 1.90 = 0.526. so the probability of both outcomes adds up to a probability of greater than 1. As the odds are balanced on either side of the bet, then the bookies stand to gain around 5% profit of the total amount bet.
This idea extends to a three way bet, but the odds are obviously split three-ways. Using this logic, we can figure out what the margin is across the last 11 season of the EPL are, at least for Bet365. It turns out that this is around 5.3% on average. The game with the lowest profit margin was West Ham vs Everton away in the 22-23 season, and the highest was Aston Villa vs Arsenal, also in the 22-23 season. There is probably some interesting analysis to do on the choice of margin to be done - but I will save that for another time.
## Distribution of total probability for EPL
total_probabilty = 1 / results$B365H + 1 / results$B365D + 1 / 1 / results$B365A

hist(total_probabilty)
Why do I care about the profit margin? well, partly it is just interesting, and partly because it leads me into my next simple betting technique - betting on all matches over some probability.
Probability-biased betting
What happens if I only bet on matches where the favourite is has a probability of winning greater than some threshold? Betting on a odds favourite always means you will win less money. This means that to make a profit you have to be right more often, and every upset (i.e. the favourite not winning) will have a bigger impact on winning margins. To do this, we need to take into account the profit margin, which I will assume it spread equally across all possibilities (W-D-L).
I will look at three probabilities, 65%, 80%, and 90%, and recycle and adjust the get_result function from above.
# Re-work the results calculator to allow for thresholds
get_result_threshold = function(r, bet = 5, threshold = 0.65){
  # using sapply retains names
  odds = sapply(r[c("B365H", "B365A")], as.numeric)
  score = sapply(r[c("FTHG", "FTAG")], as.numeric)

  # If odds are equal, this will favour the home team
  fav = str_extract(names(odds)[which.min(odds)], "[HA]")
  win = r["FTR"]

  ## Calculate the profit margin
  odds_draw = sapply(r[c("B365H", "B365D", "B365A")], as.numeric)
  profit_margin =  (1 / odds_draw["B365H"] + 1 / odds_draw["B365D"] + 1 / odds_draw["B365A"]) - 1
  pm_split = profit_margin / 3

  ## Calculate the probability of the favourite winning, less the profit split
  prob = max( (1 / odds_draw) - pm_split)

  if(fav == win & fav == "H" & prob >= threshold){
    returning_bet = (odds["B365H"] * bet) - bet
  }
  if(fav == win & fav == "A" & prob >= threshold){
    returning_bet = (odds["B365A"] * bet) - bet
  }
  if(fav != win) {
    returning_bet = -5
  }
  # if the favourite isn't above the probability threshold, don't bet.
  if(prob <= threshold){
    returning_bet = 0
  }
  returning_bet
}

## Game odds
all_results$alwaysfav_thresh0.65 = apply(all_results, 1, get_result_threshold, threshold = 0.55)
all_results$alwaysfav_thresh0.80 = apply(all_results, 1, get_result_threshold, threshold = 0.65)
all_results$alwaysfav_thresh0.90 = apply(all_results, 1, get_result_threshold, threshold = 0.8)

## Cumulative sum
all_results$alwaysfav_cumsum_0.65 = cumsum(all_results$alwaysfav_thresh0.65)
all_results$alwaysfav_cumsum_0.80 = cumsum(all_results$alwaysfav_thresh0.80)
all_results$alwaysfav_cumsum_0.90 = cumsum(all_results$alwaysfav_thresh0.90)

threshold_results = all_results %>%
  group_by(season) %>%
  mutate(yearly_cumsum.65 = cumsum(alwaysfav_thresh0.65),
         yearly_cumsum.80 = cumsum(alwaysfav_thresh0.80),
         yearly_cumsum.90 = cumsum(alwaysfav_thresh0.90)) %>%
  select(season, day_ofseason, yearly_cumsum.65, yearly_cumsum.80, yearly_cumsum.90) %>%
  pivot_longer(cols = c(yearly_cumsum.65, yearly_cumsum.80, yearly_cumsum.90))

ggplot(threshold_results, aes(x = day_ofseason, y = value, group = name, col = name)) +
  geom_line() +
  ggtitle("EPL 12/13 to 22/23 Seasons", "$5 on every favourite & threshold") +
  scale_color_manual(name = "Threshold",
                     labels = c("0.55", "0.65", "0.80"),
                     values = brewer.pal(3, "Set1")) +
  facet_wrap(~season)
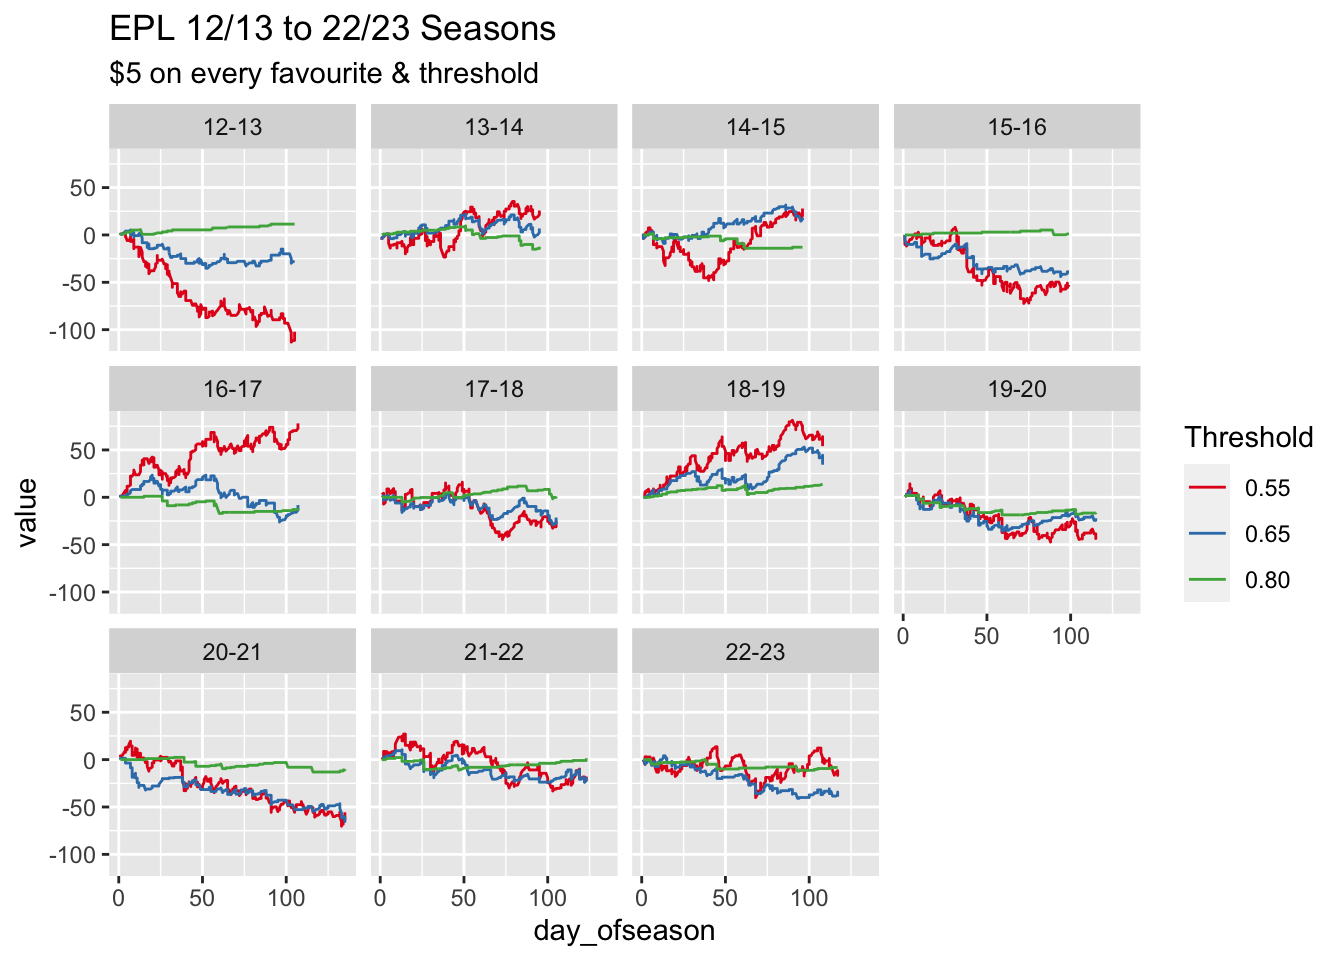
Ok. It looks like this is not a quick way to get rich. Game-by-game gambling odds seems to look after the long-term odds in these cases. Although in the odd season simple strategies work, in general it would be a losing strategy.
Tests
I also run a few tests as I go through, to make sure the calculations are working out as I expect. I have left them here for interest.
## Tests
all_results$fav_wins = all_results$FTHG > all_results$FTAG & all_results$B365H <= all_results$B365A |
  all_results$FTAG > all_results$FTHG & all_results$B365A <= all_results$B365H

## These should match but they don't
sum(all_results$fav_wins)
## [1] 2306
sum(all_results$alwaysfav >= 0)
## [1] 2301
## These are all cases where the odds were equal between teams, I picked the home team,
## These are all cases where the home team lost, and so the "favourite" lost,
## but fav wins is true, because there isn't a favourite
# which(all_results$fav_wins != (all_results$alwaysfav >= 0))